IN PATIENT MONITORING #3, we saw how to feed an Amazon DynamoDB with Health Data from a patient and we implemented an alert system if the patient heart rate is staying at zero. But you can also argue that such big amount of Health Data collected can also be analyzed to discover a trend on some health metrics, and for example diagnose a hidden disease or just to give an overview of the patient’s health.
To search, analyze and visualize our data, we will rely in this article on Elastic Stack. This stack is the combination of three software: logstash, elasticsearch and kibana.
logstash is an engine that collects any kind of data from different sources and produces dynamically unified and normalized data as output.
elasticsearch is a distributed search and analytic engine that uses indexing. It allows real-time and complex search (using an advanced request language) on a massive amount of data distributed across multiples nodes.
kibana is the data visualization tool for elasticsearch. It is used to visualize the elasticsearch search queries.
In the following Drawing 1: The Elastic stack with an AWS DynamoDB as input, we see how the Elastic Stack is used in conjunction with an AWS DynamoDB service.
Quick overview of logstash
logstash is a “dynamic data collection pipeline.” Basically, it ingests almost every format you can think of, parses (using filters) and transforms data to another format before sending it to an output. Its main features are its tremendous format support for the input and the output and the wide variety of filters:
- Input: logstash can take basic file but also syslogs, udp, tcp, http, imap, irc, and even github hook event
- Output: logstash can output a basic file but also in csv format, in elasticsearch format, etc., …
To install logstash, refer to the official documentation: https://www.elastic.co/guide/en/logstash/5.4/installing-logstash.html
Deploy the Elastic Stack with Docker
The best way to describe Docker is quoting the phrase from Docker website:
Docker is “an open source project to pack, ship and run any application as a lightweight container.” The overall idea is to provide an abstraction layer that allows software engineers to package any application and according dependencies into a container. This container can then be run on any infrastructure.
With docker, deploying the Elastic Stack becomes a child’s play. This solution can be hosted anywhere in the Cloud (Amazon EC2 Container Service, Google Cloud Platform Container Engine, …).
The elasticsearch and kibana components can be deployed as follow:
# docker run -d --name elastic -p 9200:9200 blacktop/elasticsearch _x000D_ # docker run -d --name kibana --link elastic:elasticsearch -p 5601:5601 blacktop/kibana |
The elasticsearch server will run on port 9200 and the kibana server on port 5601. The latter is taking data from the first.
Prior to starting the remaining component: logstash, its configuration needs to be prepared. The input, the filters and the output format must be specified as string for the ‘-e’ argument of the below command.
# docker run -d --name logstash -p 5044:5044 --link elastic:elasticsearch mantika/logstash-dynamodb-streams logstash -e 'input {…} filter {…} output {…}'
|
For input(s), we use the Amazon database created in a previous article:
input {_x000D_ dynamodb {_x000D_ endpoint => "dynamodb.XXX.amazonaws.com"_x000D_ streams_endpoint => "streams.dynamodb.XXX.amazonaws.com"_x000D_ view_type => "new_and_old_images"_x000D_ aws_access_key_id => "XXX"_x000D_ aws_secret_access_key => "XXX”_x000D_ table_name => "PatientData"_x000D_ }_x000D_ } |
Please ensure to adjust the properties to match your setup.
The filter configuration should parse the “Date” field from the database in UNIX format. It then should use it as a timestamp for the entry:
filter {_x000D_
        date {_x000D_
                match => [ "Date", "UNIX" ]_x000D_
        }_x000D_
}
|
We should output to our local elasticsearch server. Note that the host address in the below example is based on the Docker instance’s name for the server:
output {_x000D_
       elasticsearch {_x000D_
             hosts => "elasticsearch:9200"_x000D_
             manage_template => false_x000D_
             index => "%{[@metadata][beat]}-%{+YYYY.MM.dd}"_x000D_
             document_type => "%{[@metadata][type]}"_x000D_
      }_x000D_
}
|
Running the above mentioned docker command shall now start the logstash server on port 5601, feeding data to the elasticsearch server, and taking input from the AWS DynamoDB service.
Now, within a web browser, the data can be visualized with a kibana server.
PART III – Visualize Data with Kibana
Kibana is an interface to the elasticsearch database. It is part of the Elastic stack and thus is designed to work efficiently with it. Kibana lets you visualize Elasticsearch data and plot the results according to user’s need (bars, lines and scatter plots, or pie charts and maps etc..).
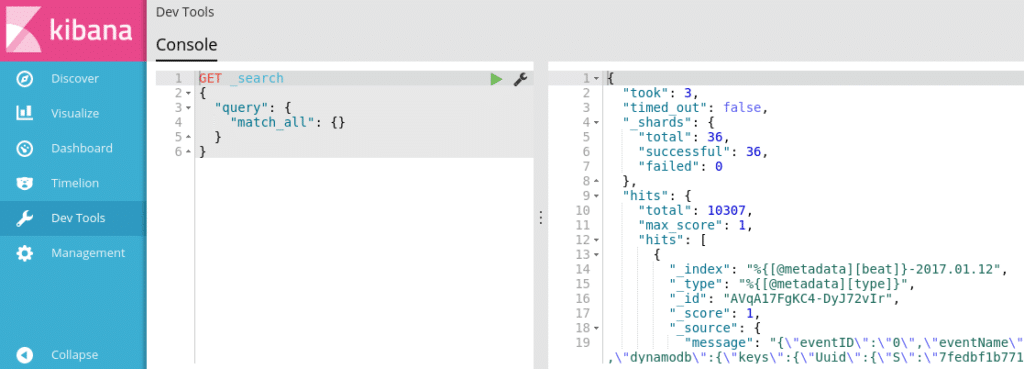
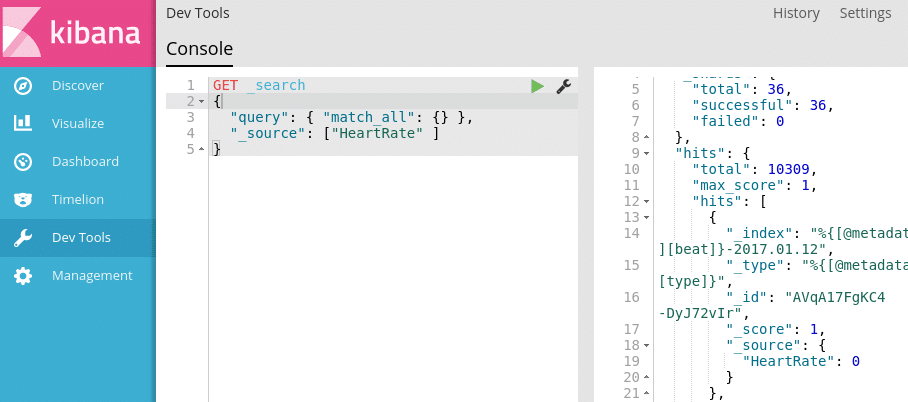
In the Dev Tools tab, we can search in the database using the elasticsearch query format.
We are looking for the HeatRate in Illustration 3: Kibana Dev Tools tab: search for the HeatRate:
Let’s visualize the Heart Rate and the average Temperature of the patient.
With Kibana, we can compile multiple visualizations into one dashboard. Then, the dashboard can be saved for later study and be shared.
Now that the data has been centralized in the Cloud, we saw how to use the ELK stack that includes logstash, elasticsearch and kibana to properly visualize these data. The ELK stack is very powerful but can be memory-hungry, the RAM and CPU consumption can quickly increase and produces unpredictable errors. To improve the ELK stack, we could gather some system metrics using Topbeat but these topics will be potentially described in future articles.
Patient Monitoring project – CONCLUSION
In this series of articles, we presented a full software patient monitoring solution that best describes challenges in designing a system integration product. These articles introduced a working and optimized solution to a crucial challenge towards medical patient monitoring, it may exist multiple other solutions that have not been described. We let the user discover them. Good Luck!


